






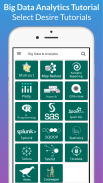

Learn All Big Data Analytics Tutorial Offline 2020

Descrizione di Learn All Big Data Analytics Tutorial Offline 2020
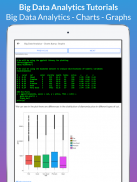
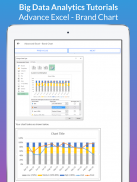
Learn Advanced Excel Charts
Excel charts are an efficient means to visualize the data to convey the results in 2020.
Learn Advanced Excel Functions
This Microsoft Excel tutorial teaches you how to create and use Excel functions. You can use Excel functions to perform various mathematical, statistical, logical calculations by 2020.
Learn Apache Flume
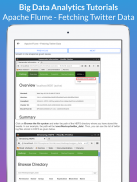
Flume is a standard, simple, robust, flexible, and extensible tool for data ingestion from various data producers (webservers) into Hadoop. In this tutorial,
Learn Apache Kafka
Apache Kafka was originated at LinkedIn and later became an open sourced Apache project in 2011, then First-class Apache project in 2012.
Apache Pig is an abstraction over MapReduce. It is a tool/platform which is used to analyze larger sets of data representing them as data flows
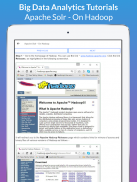
Learn Apache Solr
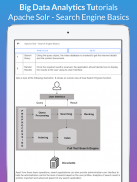
Solr is a scalable, ready to deploy, search/storage engine optimized to search large volumes of text-centric data 2020.
Learn Apache Spark
Apache Spark is a lightning-fast cluster computing designed for fast computation.
Learn Apache Storm
Storm was originally created by Nathan Marz and team at BackType. BackType is a social analytics company.
Learn Apache Tajo
Apache Tajo is an open-source distributed data warehouse framework for Hadoop.
Learn Avro
Apache Avro is a language-neutral data serialization system, developed by Doug Cutting, the father of Hadoop.
Learn AWS Quicksight
AWS Quicksight is an AWS based Business Intelligence and visualization tool
Learn Big Data Analytics
The volume of data that one has to deal has exploded to unimaginable levels in the past decade, and at the same time, the price of data storage has systematically reduced. Private companies and research institutions capture terabytes of data about their users’ interactions, business, social media, and also sensors from devices such as mobile phones and automobiles.
Learn Excel Dax
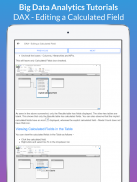
DAX (Data Analysis Expressions) is a formula language that helps you create new information from the data that already exists in your Data Model
Learn Excel Data Analysis
Data Analysis with Excel is a comprehensive tutorial that provides a good insight into the latest and advanced features available in Microsoft Excel.
Learn Excel Pivot Tables
PivotTable is an extremely powerful tool that you can use to slice and dice data.
Learn Excel Macros
An Excel macro is an action or a set of actions that you can record, give a name, save and run as many times as you want and whenever you want.
Learn Excel Power Pivot
Excel Power Pivot is an efficient, powerful tool that comes with Excel as an Add-in.
Learn Excel Power View
Power View enables interactive data exploration, visualization, and presentation that encourages intuitive ad-hoc reporting.
Learn Google Charts
Google Charts is a pure JavaScript based charting library meant to enhance web applications by adding interactive charting capability.
Learn Hadoop
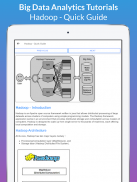
Hadoop is an open-source framework that allows to store and process big data in a distributed environment across clusters of computers using simple programming models.
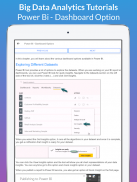
Learn Power BI
Power BI is a Data Visualization and Business Intelligence tool that converts data from different data sources to interactive dashboards and BI reports.
Learn QlikView
QlikView is a leading Business Discovery Platform.
Learn R Programming
R is a programming language and software environment for statistical analysis, graphics representation and reporting.
Learn SAS
SAS is a leader in business analytics. Through innovative analytics it caters to business intelligence and data management software and services.
Learn Spark SQL
Apache Spark is a lightning-fast cluster computing designed for fast computation. It was built on top of Hadoop.
Learn Statistics
This Statistics preparation material will cover the important concepts of Statistics syllabus. It contains chapters discussing all the basic concepts of Statistics with suitable
Scopri i grafici avanzati di Excel
I grafici Excel sono un mezzo efficiente per visualizzare i dati per trasmettere i risultati nel 2020.
Scopri le funzioni avanzate di Excel
Questo tutorial di Microsoft Excel ti insegna come creare e usare le funzioni di Excel. È possibile utilizzare le funzioni di Excel per eseguire vari calcoli matematici, statistici e logici entro il 2020.
Scopri Apache Flume
Flume è uno strumento standard, semplice, robusto, flessibile ed estensibile per l'immissione di dati da vari produttori di dati (server web) in Hadoop. In questo tutorial,
Scopri Apache Kafka
Apache Kafka è nato a LinkedIn e successivamente è diventato un progetto Apache di provenienza aperta nel 2011, quindi progetto Apache di prima classe nel 2012.
Apache Pig è un'astrazione su MapReduce. È uno strumento / piattaforma che viene utilizzato per analizzare gruppi di dati più grandi che li rappresentano come flussi di dati
Scopri Apache Solr
Solr è un motore di ricerca / archiviazione scalabile, pronto per l'implementazione, ottimizzato per la ricerca di grandi volumi di dati centrati sul testo 2020.
Scopri Apache Spark
Apache Spark è un cluster computing estremamente veloce progettato per un calcolo veloce.
Scopri Apache Storm
Storm è stato originariamente creato da Nathan Marz e dal team di BackType . BackType è una società di analisi sociale.
Impara Apache Tajo
Apache Tajo è un framework di data warehouse distribuito open source per Hadoop.
Impara Avro
Apache Avro è un sistema di serializzazione dei dati indipendente dalla lingua, sviluppato da Doug Cutting, il padre di Hadoop.
Scopri AWS Quicksight
AWS Quicksight è uno strumento di visualizzazione e Business Intelligence basato su AWS
Scopri Big Data Analytics
Il volume di dati che si devono trattare è esploso a livelli inimmaginabili nell'ultimo decennio e, allo stesso tempo, il prezzo della memorizzazione dei dati si è sistematicamente ridotto. Le aziende private e gli istituti di ricerca acquisiscono terabyte di dati sulle interazioni degli utenti, sul business, sui social media e anche sui sensori da dispositivi come telefoni cellulari e automobili.
Scopri Excel Dax
DAX (Data Analysis Expressions) è un linguaggio di formula che consente di creare nuove informazioni dai dati già esistenti nel modello di dati
Scopri l'analisi dei dati di Excel
Analisi dei dati con Excel è un tutorial completo che fornisce una buona visione delle funzionalità più recenti e avanzate disponibili in Microsoft Excel.
Scopri le tabelle pivot di Excel
PivotTable è uno strumento estremamente potente che puoi utilizzare per tagliare e tagliare i dati.
Scopri le macro di Excel
Una macro di Excel è un'azione o un insieme di azioni che è possibile registrare, assegnare un nome, salvare ed eseguire tutte le volte che vuoi e quando vuoi.
Scopri Excel Power Pivot
Excel Power Pivot è uno strumento efficiente e potente fornito con Excel come componente aggiuntivo.
Scopri Excel Power View
Power View consente l'esplorazione, la visualizzazione e la presentazione di dati interattivi che incoraggiano un reporting ad hoc intuitivo.
Scopri i grafici di Google
Google Charts è una libreria di creazione di grafici basata su JavaScript allo scopo di migliorare le applicazioni Web aggiungendo funzionalità di creazione di grafici interattivi.
Impara Hadoop
Hadoop è un framework open source che consente di archiviare ed elaborare i big data in un ambiente distribuito tra cluster di computer utilizzando semplici modelli di programmazione.
Scopri Power BI
Power BI è uno strumento di visualizzazione dei dati e Business Intelligence che converte i dati da diverse origini dati in dashboard interattivi e report BI.
Scopri QlikView
QlikView è una piattaforma di scoperta aziendale leader.
Impara la programmazione R
R è un linguaggio di programmazione e un ambiente software per analisi statistiche, rappresentazione grafica e reportistica.
Impara SAS
SAS è leader nell'analisi aziendale. Attraverso analisi innovative si rivolge a software e servizi di business intelligence e gestione dei dati.
Scopri Spark SQL
Apache Spark è un cluster computing estremamente veloce progettato per un calcolo veloce. È stato costruito sulla cima di Hadoop.
Impara le statistiche
Questo materiale di preparazione delle statistiche tratterà i concetti importanti del programma statistico. Contiene capitoli che discutono di tutti i concetti di base di Statistica con opportuni


